I went through the same procedure as last time.
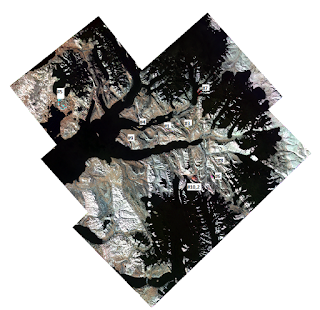
First I drew ten ROIs or regions of interest based on the color of the SWIR R: Band 4 (1.60-1.70 micrometers), G: Band 6 (2.185-2.225 micrometers), B: Band 8 (2.295-2.365 micrometers) color composite. I chose magenta regions assuming that they should represent salt domes (as show in the images below).


In order to compare salt domes with each other I visualized their spectra in one graph with the help of ENVI 5.3 software.
The bottom three spectra (# 5, 3 and 2) look at little bit different from the rest of the spectra as first I tried to use the same regions of interest which were created based on the TIR image, however it did not work very well as some shaded areas got included. Otherwise all the spectra look very similar.
Next step is to compare the obtained spectra to the Spectral Libraries. I used a Spectral Library included in the ENVI software called aster_mineral_usgs_perknic_2756. However, this Spectral Library is designed for hyperspectral imagery and in order to be used for multispectral data it has to be resampled. I used the tool called Spectral Resampling in order to resample the spectral library to the wavelength range I am interested in, which is 1.60 - 2.43 micrometer, and a necessary number of bands (SWIR ASTER data consists of 6 spectral bands).
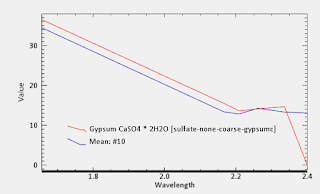
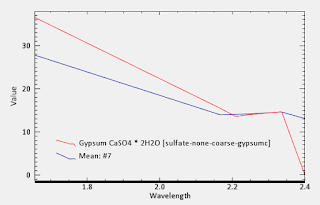
Once the mineral library was resampled I could run Spectral Analyst tool to compare my spectra to the library spectra. These are results for some of the salt domes (gypsum was always first on the list):


Spectral Analyst confirmed that the areas highlighted as magenta in the SWIR imagery are indeed salt domes composed of gypsum.
When I was analyzing TIR (thermal infra-red) imagery it was unclear whether we are dealing with anhydrite (CaSO4) or gypsum (CaSO4.2H2O) because their spectra are very close in the thermal range, however, in short wave infra-red it is easier to distinguish between the two as shown in the figure below (red frame) (Bishop, 2014):

References:
Bishop, J., Lane, M., Byar, M., King, S., Brown, A., & Swayze, G. (2014). Spectral properties of ca-sulfates: Gypsum, bassanite, adn anhydrite. American Mineralogist, 99(10), 2105-2115. doi:10.2138/am-2014-4756

Mike and I were chatting, and he suggested using supervised classification to map these salt deposits automatically. We could compare those maps to the mapping you did by eye. Please chat with him about this next week.
ReplyDelete